
They Lied: The COVID Vaccinated Are Classified as “Unvaccinated” to Distort the Data
Wow. Just, wow.

This article originally appeared on Jessica Rose’s Substack and was republished with permission.
Guest post by Dr. Jessica Rose
If you got 1 dose, you’re injected [vaccinated] - a truer representation of MMWR data.
I spent some time today revisiting the MMWR data for LA county that was published by the MMWR that claimed that most of the people who succumbed to SARS-2 “infection” were “unvaccinated”.
I have written about this before as has Norman Fenton et al., and by ‘this’ I mean the improper classification of “unvaccinated” individuals that goes like the following:

This is truly insincere and convoluted beyond belief. Read it twice. Or three times.
Unvaccinated individuals were dosed. “Unvaccinated <14 days receipt of the first dose of a 2-dose series OR 1 dose of the single dose vaccine.” Do you understand what they did here?
Here’s what their hospitalization in the context of SARS-2 “infection” data look like as reported using this wildly convoluted definition of unvaccinated.
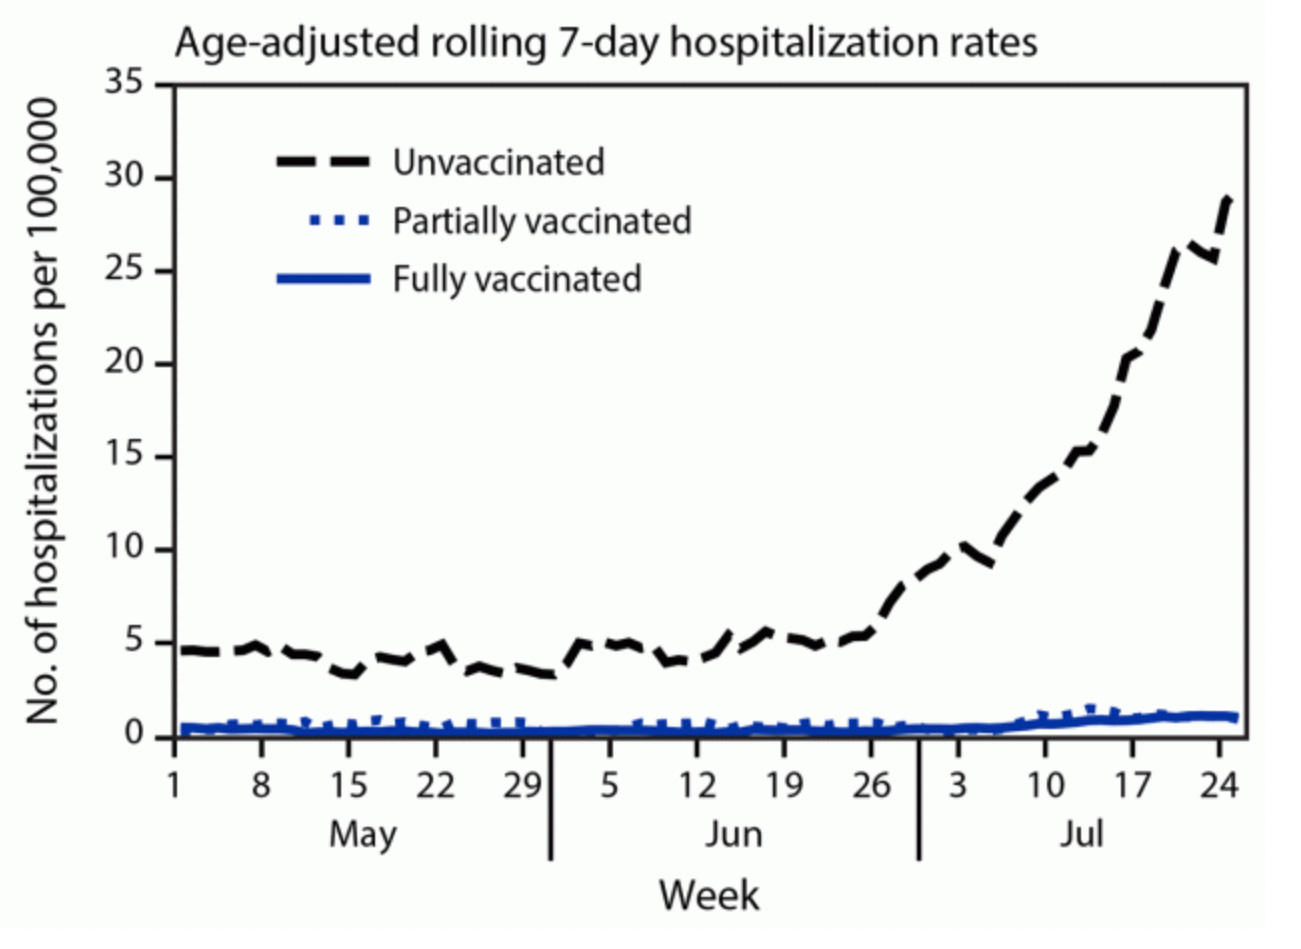
Wow! Look! It’s the “unvaccinated” who were hospitalized the most! But seeing as how these “unvaccinated” individuals likely received at least 1 dose, then they were certainly qualify as being “vaccinated”, no? When speaking of hospitalization, we are referring to my ballpark: SAEs, such as hospitalizations reported to VAERS. If one ends up in the hospital shortly after receiving a COVID-19 injection, one MUST consider that this individual as INJECTED, ie: “vaccinated”. Serious adverse events in the context of biologicals are reported to pharmacovigilance databases such as VAERS precisely because they are in the context of a biological product such as the COVID-19 modmRNA-LNP injectable products. The “antibody” 14-day wait period has nothing to do with adverse events and these 2 things - antibody responses and AEs - cannot be confounded.
Here’s the data replotted using R side-by-side with this same data replotted considering that 60% of the population of LA county were injected with at least 1 dose by the end of July 2021.
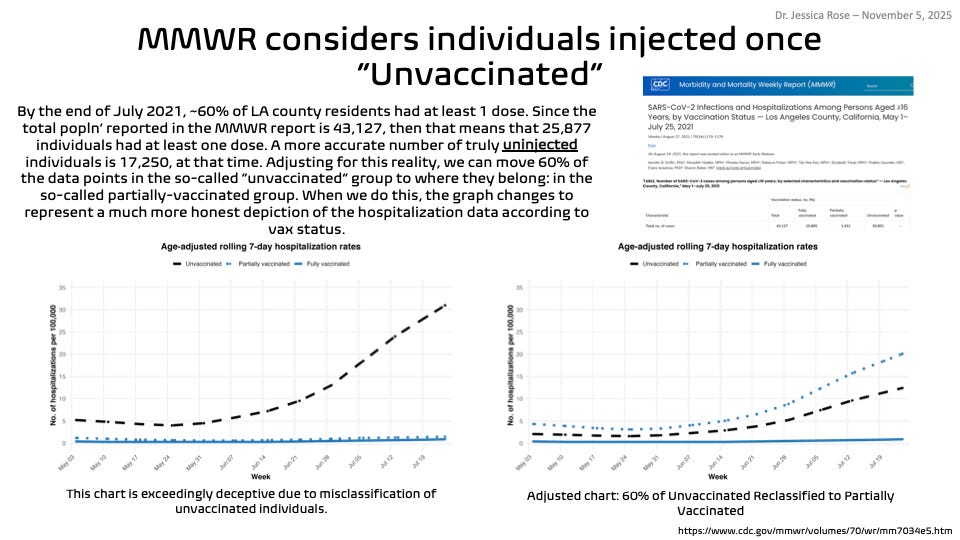
The plot of the right is a much more likely accurate representation of the data. You see how the “unvaccinated” black dotted line is lower than the “partially-vaccinated” blue dotted line. This means that individuals who got 1 shot were hospitalized more. And they were.
And here’s an even less convoluted representation of the data where we lose the stupid partially-vaccinated classification and simply go with Injected or Uninjected.
I also included the likely “real” numbers that comprise each group. It’s simply stupid to think that most of the individuals who were hospitalized were “unvaccinated” as is portrayed in the data on the left.
This reality seems to be making a comeback so I thought to lay it our really simplistically for everyone. It’s really clear what they did here: they misclassified individuals as “unvaccinated” using antibody jargon and entirely misled the public by claiming that most of the individuals who were hospitalized were “unvaccinated”.
Copyright 2025 Dr. Jessica Rose

I remember reading about this counting deception back in October 2021 when the mandates were being applied to us and all possible alternatives to taking the "vaccine" were considered to be "off the table".
Yes, that old case counting window bias and the Lyons-Weiler/Fenton effect! See https://pubmed.ncbi.nlm.nih.gov/37452751/ and This Second Most Important COVID19 Studies Bias, the Lyons-Weiler/Fenton/Neil Bias, is Confirmed as "Case-Counting Window Bias" https://popularrationalism.substack.com/p/lyons-weilerfenton-bias-confirmed first identified by yours truly in The Defender: https://childrenshealthdefense.org/defender/discrepancies-modernas-fda-report-demand-answers/